Identifying development and climate vulnerability hotspots
Understanding the interplay between multiple climate change risks and socioeconomic development is increasingly required to inform policies to manage these risks in pursuit of the sustainable development agenda. To this end, IIASA researchers working on the Integrated Solutions for Water, Energy, and Land (ISWEL) project conducted a comprehensive assessment of the potential exposure of global and vulnerable populations to multi-sectoral climate risk hotspots under different levels of global warming.
The 21st century will see the global population increase from 7.5 billion in 2017, to an expected 8.5-10 billion in 2050 [1]. Future populations will be exposed to a growing range of climate change hazards of varying intensities, with some areas–or hotspots–exposed to more risks than others [2]. These risks are not just dependent on the severity of climate change and subsequent hazards, but also hinges critically on the population’s exposure, and their vulnerability and capacity to prepare for and manage changing risks. Recently, a few studies have brought attention to the fact that the world’s poorest are disproportionately exposed to climate risks, such as changes in temperature extremes and challenging hydro-climatic complexity [3].
In order to inform effective, integrated policy responses to these problems, it is necessary to assess the exposure of future global and vulnerable populations to multi-sector climate impact hotspots. IIASA researchers working on the ISWEL project investigated where the main multi-sector risk hotspots are located globally, how they might change with higher levels of global mean temperature rise, and to what extent socioeconomic development and poverty reduction can reduce risks. The results of their assessments indicate that, although global exposure to multi-sector risks will affect a relatively small fraction of global land area, the risks to human populations will be large.
The general structure of the assessment comprised the development of 14 climate and development indicators across the water, energy, and land sectors, and the aggregation of impacts and risks using new and established methods to produce multi-sector risk hotspot maps. These maps were then compared for 1.5°C, 2.0°C, and 3.0°C changes in global mean temperature above pre-industrial conditions. The exposure of global and vulnerable populations (i.e., those with an income of less than US$10 per day) was also investigated using three socioeconomic projections from the Shared Socioeconomic Pathways (SSPs 1-3). The results of these assessments are presented at the global grid and Intergovernmental Panel on Climate Change (IPCC) region scales.
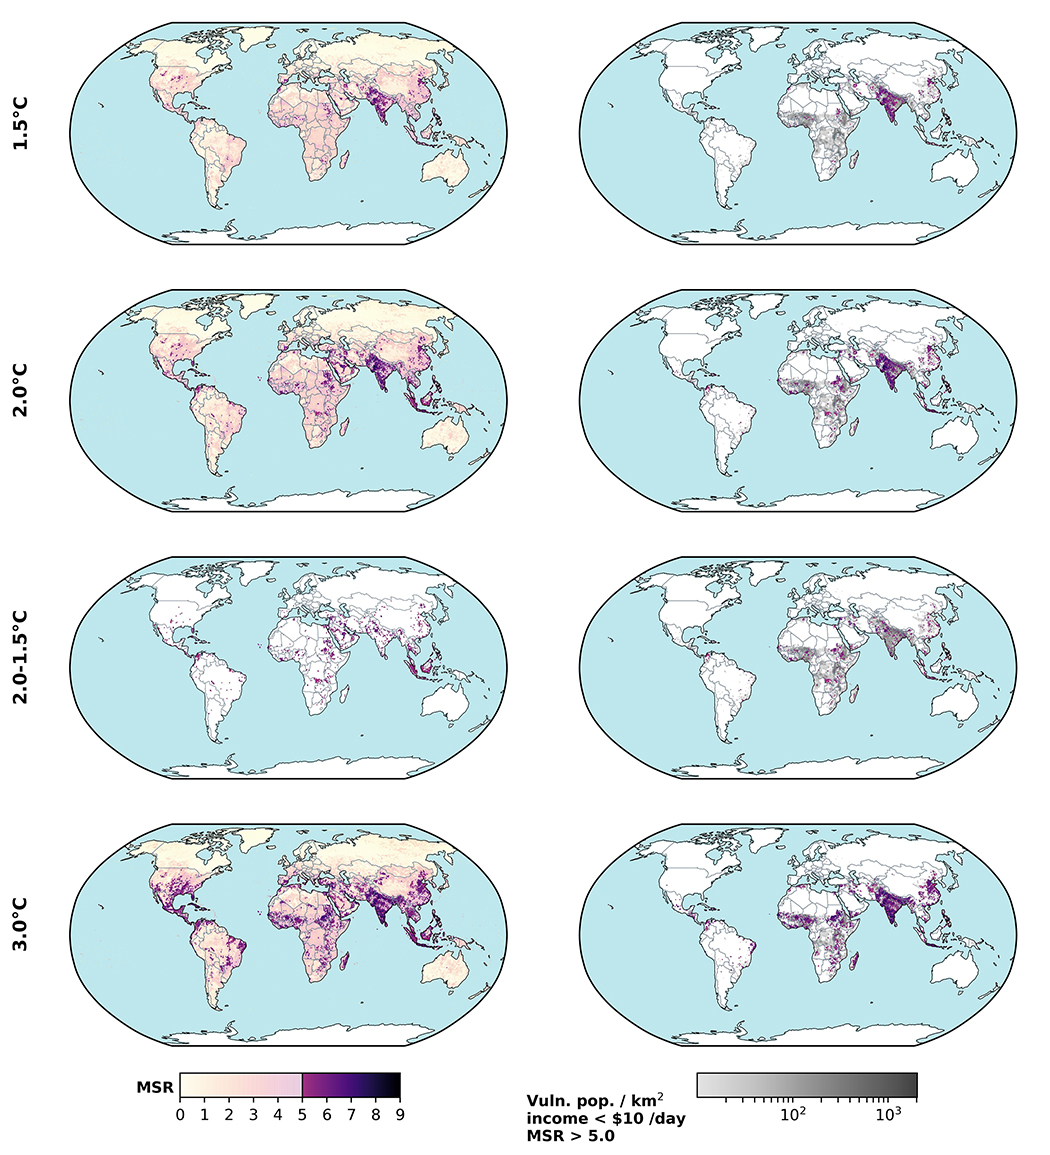
Multi-sector risk (MSR) maps for 1.5, 2.0, and 3.0°C climates [4]. Left column shows the full score range 0-9 (with transparency) and multi-sector risk score, MSR≥5.0, in full colour. Right column greyscale underlay is the SSP2 2050 vulnerable populations, with the MSR≥5.0 overlaid (only pixels > 10 vulnerable /km2), indicating the concentrations of exposed and vulnerable populations. Moderate and high multi-sector impacts are prevalent where vulnerable people live, predominantly in South Asia at 1.5°C, but spreading to East Asia, the Middle East, and sub-Saharan Africa at higher warming.
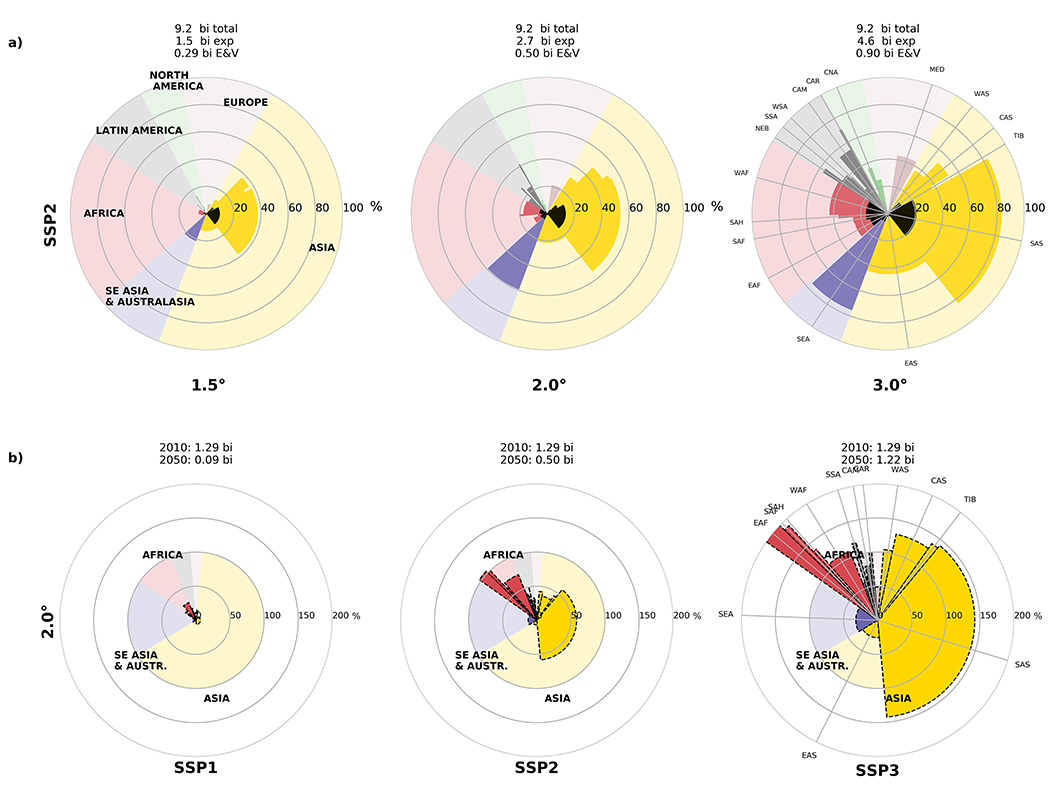
Global population exposure and vulnerability [4]. Top (a) background is the total global population for SSP2 in 2050, while in the foreground, the fraction of exposed population (MSR ≥ 5.0, strong colors). Black shaded central segments are the exposed and vulnerable (E&V) population. For global exposure, global mean temperature is the dominant driver over SSP population. However, the bottom panel (b) shows how important socioeconomic development is for reducing the E&V population. It compares the E&V population for a 2.0°C climate in 2010 (background circle, currently 4.2 billion), with the projected E&V population in 2050 (foreground segments). While poverty reduction in SSP1 almost eradicates the E&V population in most regions by 2050, SSP3 results in substantial increases in Asia and Africa compared to 2010, due to high levels of inequality.
Climate mitigation alone will not be enough to reduce the exposure of the world’s poorest, who will still be vulnerable to impacts at 1.5°C. According to the researchers, action to rapidly reduce inequality, eradicate poverty, and promote proactive adaptation through mechanisms such as the Sustainable Development Goals, would greatly reduce the size of exposed and vulnerable populations, especially if co-benefits for climate mitigation also accrue.
References
[1] KC S & Lutz W (2014). Demographic scenarios by age, sex and education corresponding to the SSP narratives. Population and Environment 35 (3): 243-260.
[2] Piontek F, Mueller C, Pugh TAM, Clark DB, Deryng D, Elliott J, González FGC, Flörke M, et al. (2014). Multisectoral climate impact hotspots in a warming world. Proceedings of the National Academy of Sciences USA 111 (9): 3233-3238.
[3] Satoh Y, Kahil T, Byers E, Burek P, Fischer G, Tramberend S, Greve P, Flörke M, et al. (2017). Multi-model and multi-scenario assessments of Asian water futures: the Water Futures and Solutions (WFaS) initiative. Earth’s Future 5 (7): 823-852.
[4] Byers E, Gidden M, Leclere D, Burek P, Ebi KL, Greve P, Grey D, Havlik P, et al. (2018). Global exposure and vulnerability to multi-sector development and climate change hotspots. Environmental Research Letters
IIASA Contributors
- Edward Byers, Matthew Gidden, Juraj Balkovic, Peter Burek, Peter Greve, Petr Havlik, Nils Johnson, Taher Kahil, Volker Krey, Simon Langan, David Leclère, Nebjosa Nakicenovic, Michael Obersteiner, Shonali Pachauri, Amanda Palazzo, Simon Parkinson, Narasimha Rao, Joeri Rogelj, Yusuke Satoh, Yoshihide Wada, Barbara Willaarts, Keywan Riahi
Collaborators
- Global Environment Facility (GEF) (Astrid Hillers)
- United Nations Industrial Development Organization (UNIDO) (Robert Novak)
- University of Washington (Kristie Ebi)
- University of Oxford (David Grey)
Funders
Further information
Other highlights


Top image © Piyaset | Shutterstock
You must be logged in to post a comment.